Export metrics from Astro
You can export comprehensive metrics about your Apache Airflow usage on Astro directly to any third-party monitoring and alerting system using the Universal Metrics Exporter. This gives you unlimited access to all infrastructure metrics that are available to Astronomer and allows you to use your preferred observability tooling, such as Grafana or CloudWatch.
While Deployment Analytics, Deployment health incidents, and exporting metrics and logs to Datadog on Astro can all help you understand your Airflow usage and infrastructure resource consumption, the Universal Metrics Exporter is additionally valuable because it:
- Gives you access to both Kubernetes-level infrastructure metrics as well as task-level execution information specific to Apache Airflow.
- Provides metrics that aren't available to Datadog's supported Airflow metrics.
- Uses the Prometheus data model format using the remote-write capability, making it flexible and easy to use.
- Allows you to configure a metrics export at the per-Deployment level or at the Workspace level.
- Enables you to customize your observability experience with your tooling and create custom dashboards or alerts that are not currently available in Astro.
- Offers a way to add custom metadata as labels to your exported metrics or HTTP request headers.
You can use this information to right-size Celery workers, optimize your usage of the Kubernetes executor, and stay informed about task execution status.
Metric categories
There are two categories of metrics that you can export using the Universal Metrics Exporter:
- Airflow application level metrics
- Infrastructure level metrics
Both application and infrastructure metrics have metadata labels associated with them. The following list shows the default standard set of labels that Astro attaches to each metric:
cloud_providercloud_regioncluster_organization_idcontainernamespacepoddeploymentIdorganizationIdworkspaceId
Some metrics additionally include labels that are specific and unique to that metric. Use these metadata labels to identify each individual metric with its corresponding environment in Astro.
Custom metadata
In addition to the default metadata included by Astro with your metrics, you can also add Custom headers and Custom labels to your metrics exports.
- Custom headers add key-value pairs to the HTTP request made by Astro to your Prometheus server.
- Custom labels add key-value pairs to the export metadata, so you can filter your metrics downstream.
Airflow application metrics
Airflow application metrics are defined by Apache Airflow and are related to the health, success, and performance of the DAGs that are orchestrated and executed by Airflow.
For example, Airflow application metrics include:
- The number of task instance failures in your Deployment
- The number of SLA misses in your Deployment
- The number of zombie tasks killed
- The historical count of scheduler hearbeats
To see the complete list of Airflow application metrics that Astro supports, see the Astro StatsD repository. To learn more, read the descriptions of each metric Airflow metrics descriptions in Airflow documentation. .
Infrastructure metrics
Infrastructure metrics can help you understand information about the individual Kubernetes nodes and pods that run each Airflow component. These metrics indicate the usage, health, and performance of the pods based on your workload and use case. See the table below for the list of infrastructure metrics that Astro supports.
| Name | Description |
|---|---|
container_cpu_usage_seconds_total | CPU usage |
container_memory_working_set_bytes | Memory usage |
kubelet_stats_ephemeral_storage_pod_usage | Ephemeral storage usage |
kube_pod_status_* | Kubernetes pod status |
kube_pod_labels | Kubernetes pod label |
kube_pod_container_resource_limits | Exports CPU, memory, and storage limits for Celery workers, kubernetes executors, and KubernetesPodOperator pods. |
kube_pod_container_status_terminated_reason | Kubernetes container termination reason |
Prerequisites
- Supported Auth: Bearer token or license key, username and password, or custom HTTP header(s) of your target data observability server (Optional)
- A Prometheus data endpoint
- Network connectivity between your Astro resources and Prometheus endpoint
Set up your Prometheus endpoint
The following list includes the setup instructions of different, commonly used Prometheus endpoints. Use these resources to set up your observability tools to receive metrics exports from Astro.
Enable metrics export
You can enable metrics export at both the Workspace and Deployment level for Astro Hosted, but only in individual Deployments for Astro Hybrid.
Workspace metrics
-
In the Astro UI, select Environment on the sidebar menu.
-
Click the Metrics Export tab to configure your metrics export.
-
Click + Metrics Export to create a new export connection.
-
Enter the required information for your export, the Name and Endpoint.
tipFor the endpoint, you might need to use a format like
http://prometheus.<internal-hostname>/api/v1/write -
(Optional) Click More Options to add additional information for your endpoint:
- Token - A bearer token or license key for your Prometheus endpoint.
- Username and Password - Credentials for basic authentication, if needed.
- Custom Headers - Add a Name and Value pair that can be sent to your server as part of the HTTP request with each remote write. If you add a custom header, any default values are overwritten by your custom configuration. You can add Deployment-specific labels when configuring Deployment metrics.
- Custom Labels - Add a Name and Value pair that can be sent to your server. You can add Deployment-specific labels when configuring Deployment metrics.
-
Click Create metrics export.
-
(Optional) Allow all Deployments to link to this metrics export configuration. See Link metrics export.
Deployment metrics
-
In the Astro UI, select a Deployment, then click the Environment tab within the Deployment menu.
-
Click the Metrics tab to configure your metrics export.
-
Click + Metrics Export to configure a new export connection.
-
Enter the required information for your export, the Name and Endpoint.
tipFor the endpoint, you might need to use a format like
http://prometheus.<internal-hostname>/api/v1/write -
(Optional) Click More Options to add additional information for your endpoint:
- Token - A bearer token or license key for your Prometheus endpoint.
- Username and Password - Credentials for basic authentication, if needed.
- Custom Headers - Add a Name and Value pair that can be sent to your server with as part of the HTTP request with each remote write. If you add a custom header, any default values or values configured at the Workspace level are overwritten by your custom configuration.
- Custom Labels - Add a Name and Value pair that can be sent to your server. You can add Deployment-specific labels when configuring Deployment metrics.
-
Click Create metrics export.
If you successfully connected your metrics export to your observability service endpoint, after five minutes, your Astro metrics begin to populate in your observability service.
Share metrics exports across Deployments
You can configure Astro to link Workspace-level metrics exports to all Deployments in the Workspace by default.
This is useful, for example, when you need to configure a metrics export for development environments that all Deployments in a Workspace should start with. Then, when you create new Deployments, they automatically have a default metrics export configuration to your development resources.
When you're ready to move your Deployments' metrics exports to production configurations, you can either replace the metrics export or override the configuration values with your production resource information.
If you change the setting from Restricted to Linked to all Deployments, Astro respects any metrics exports fields that you might have configured for existing linked Deployments.
- Click Environment in the main menu and open the Metrics Export page.
- Click the name of the export target that you want to add per-Deployment field overrides to.
- Click Deployment Sharing and toggle the setting to choose either:
- Restricted: Only share individually to Deployments.
- Linked to all Deployments: Link to all current and future Deployments in this Workspace.
- (Optional) Change the default field values.
- Click Update metrics export to save.
Override configuration fields
If you create a metrics export at the Workspace level and link it to a Deployment, you can later edit the endpoint within the Deployment to specify field overrides. When you override a field, you specify values that you want to use for a one Deployment, but not for others. This way, you can configure a metrics export for a single time, but still have the flexibility to customize it at the Deployment level.
For example, you might have created a metrics connection to a dev or internal observability endpoint, and then later you can add field overrides to specify production details you want each Deployment to use.
- Click Environment in the main menu, and click the Metrics Export tab.
- Click the metrics export that you want to add per-Deployment field overrides to.
- (Optional) Click Deployment Sharing and choose if you want to Restrict or Link to all Deployments. You can also change the default field values. Click Update metrics export to save.
- Click Edit to open the metrics export configurations for a specific linked Deployment.
- Add the override values to the fields you want to edit. You might need to open More options to find the full list of available fields.
- Click Update metrics export.
Example: Grafana Cloud dashboard
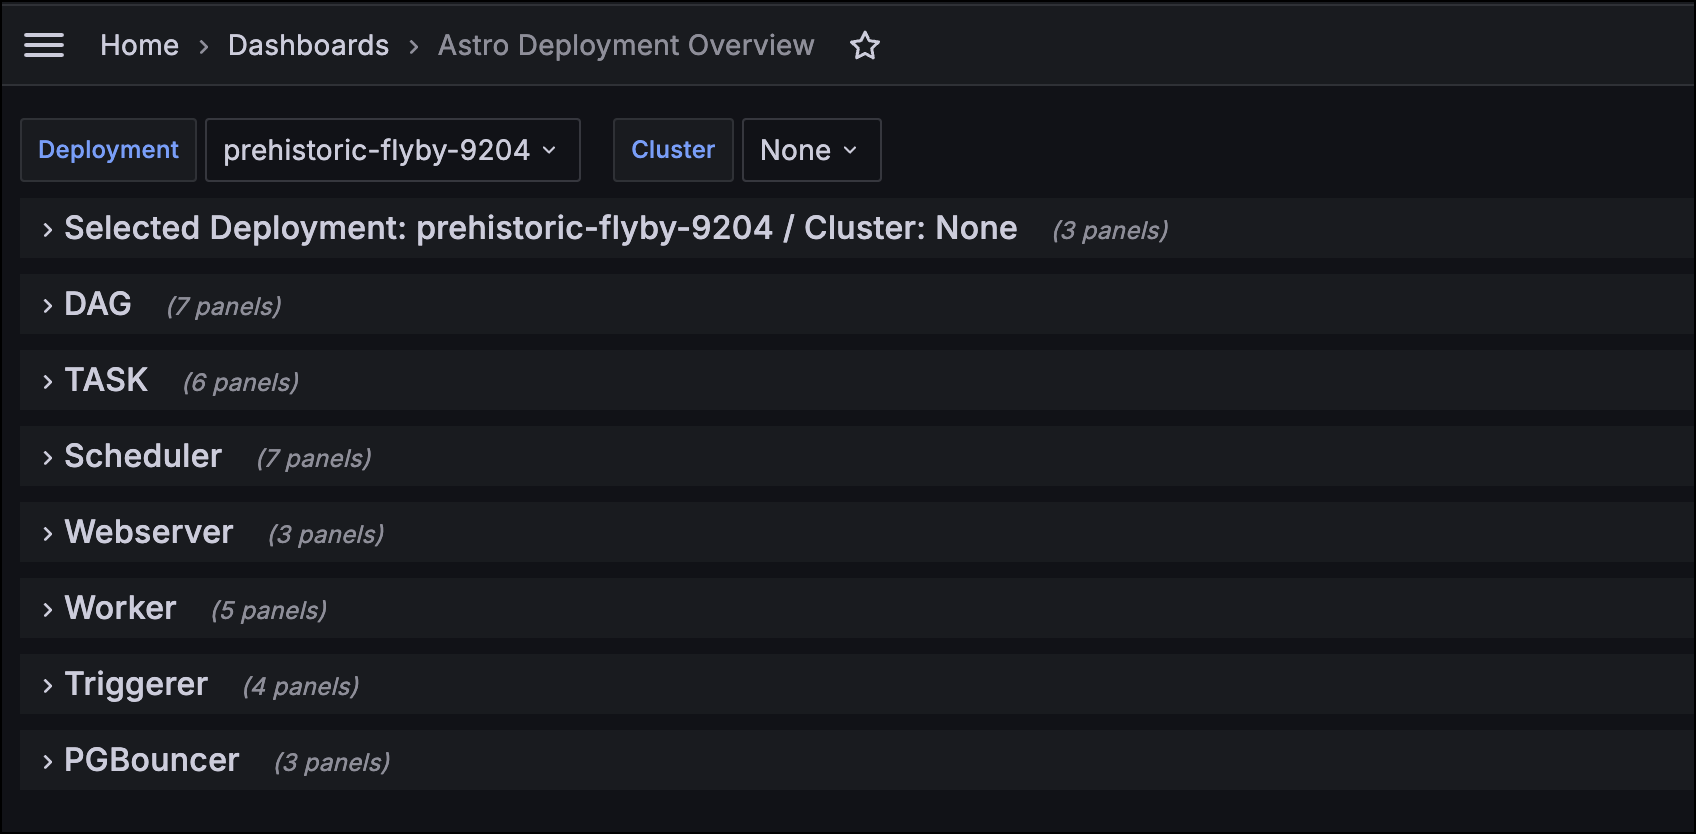
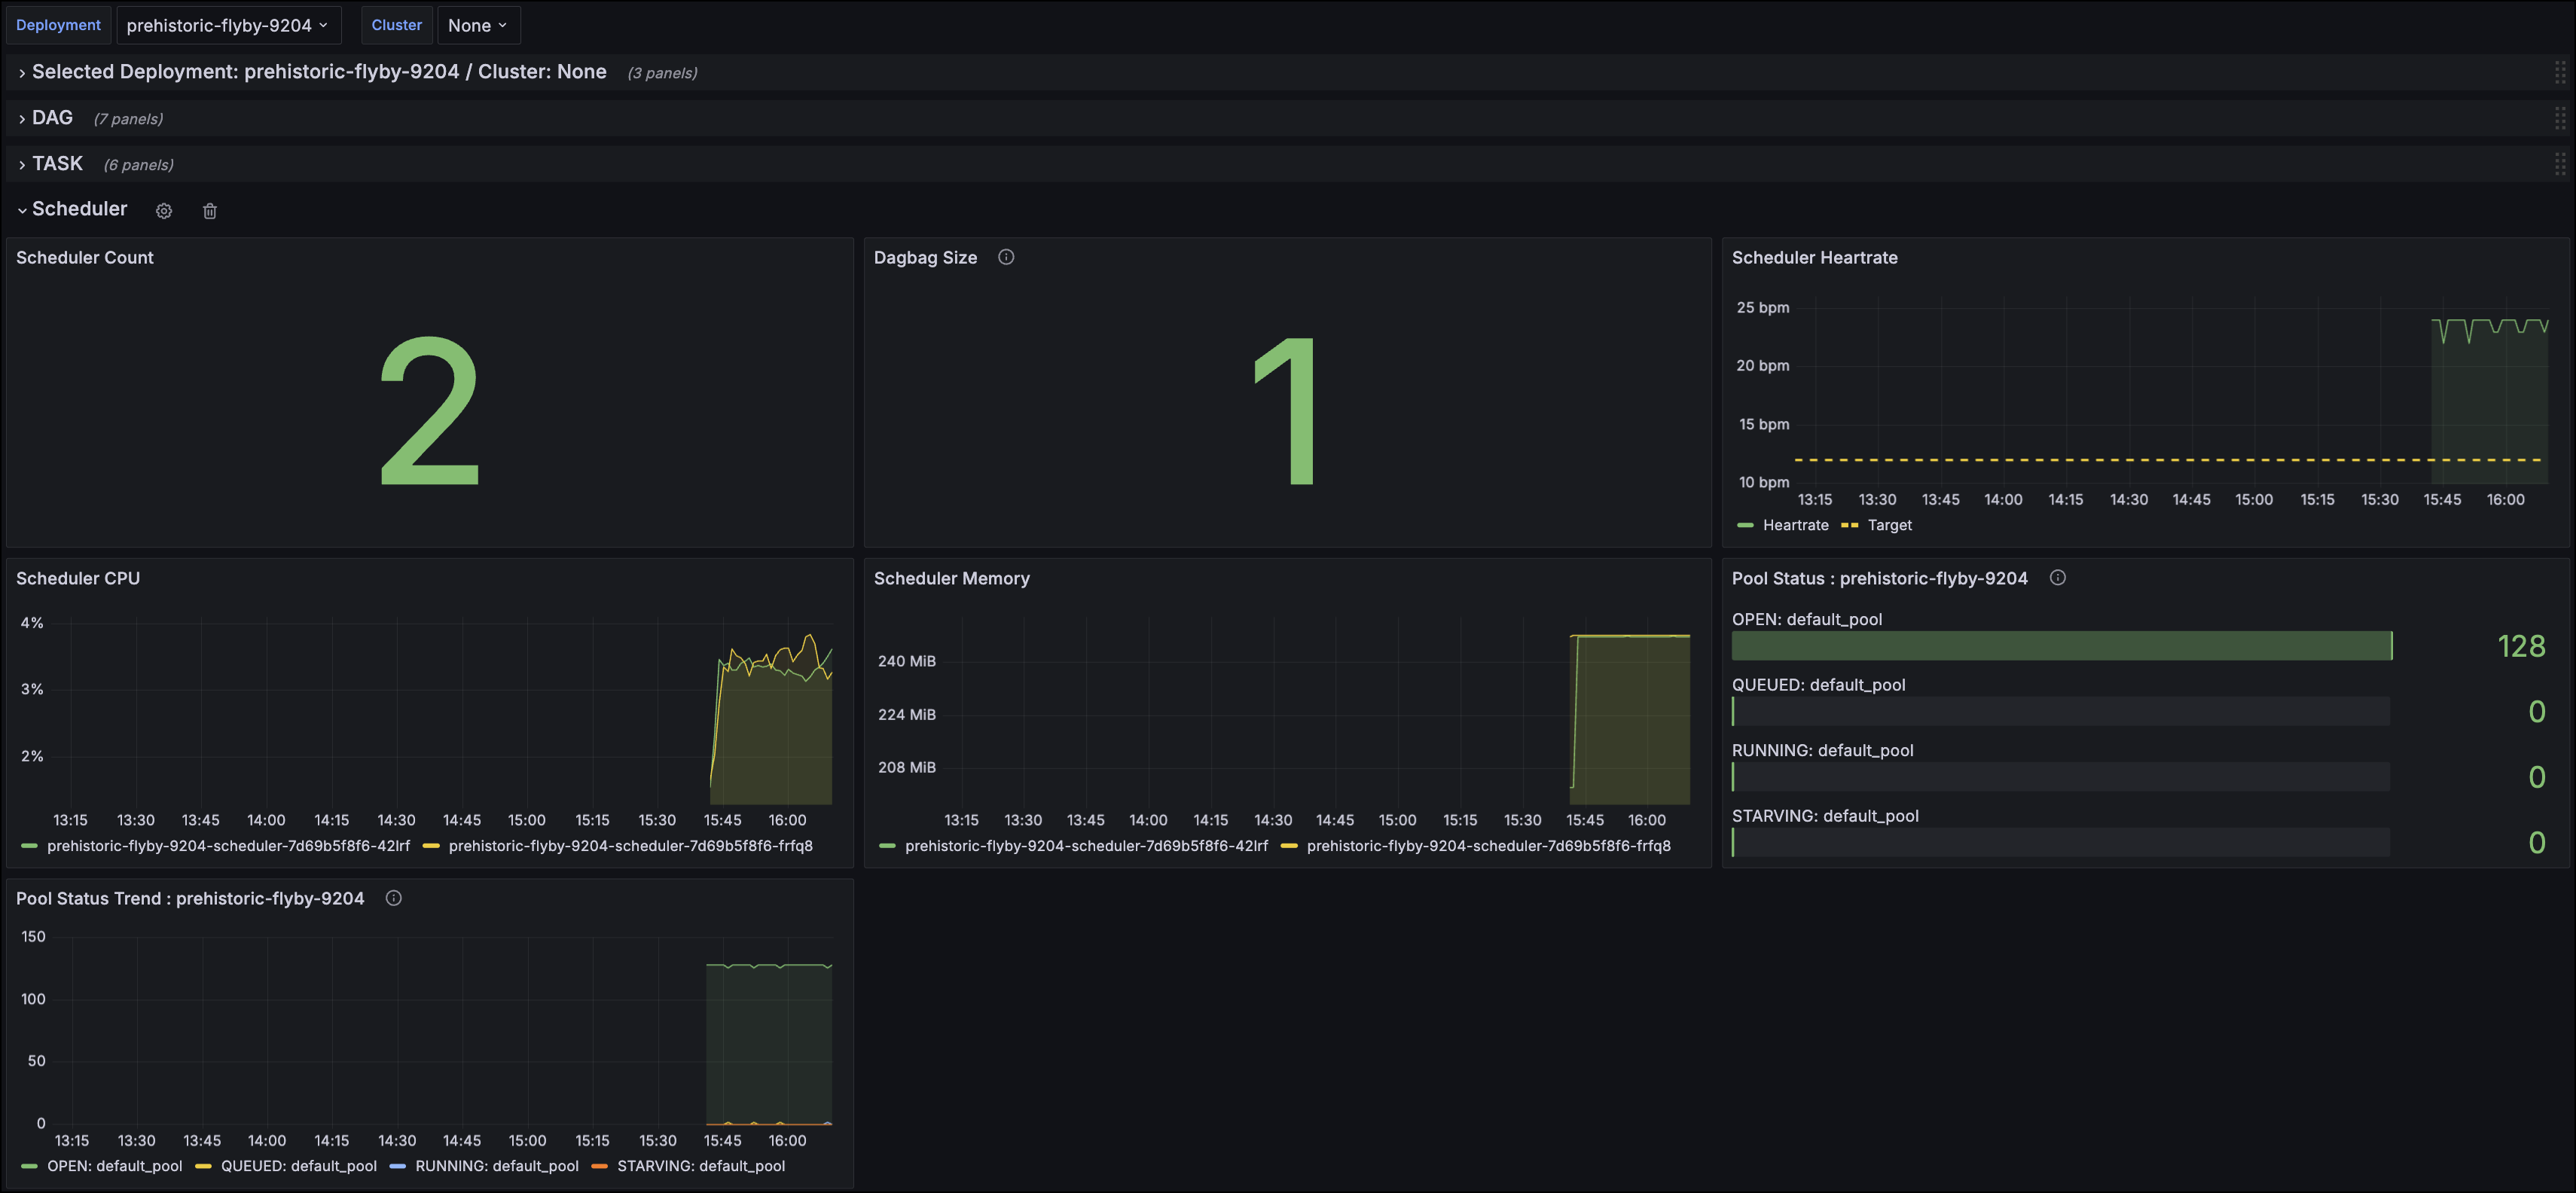
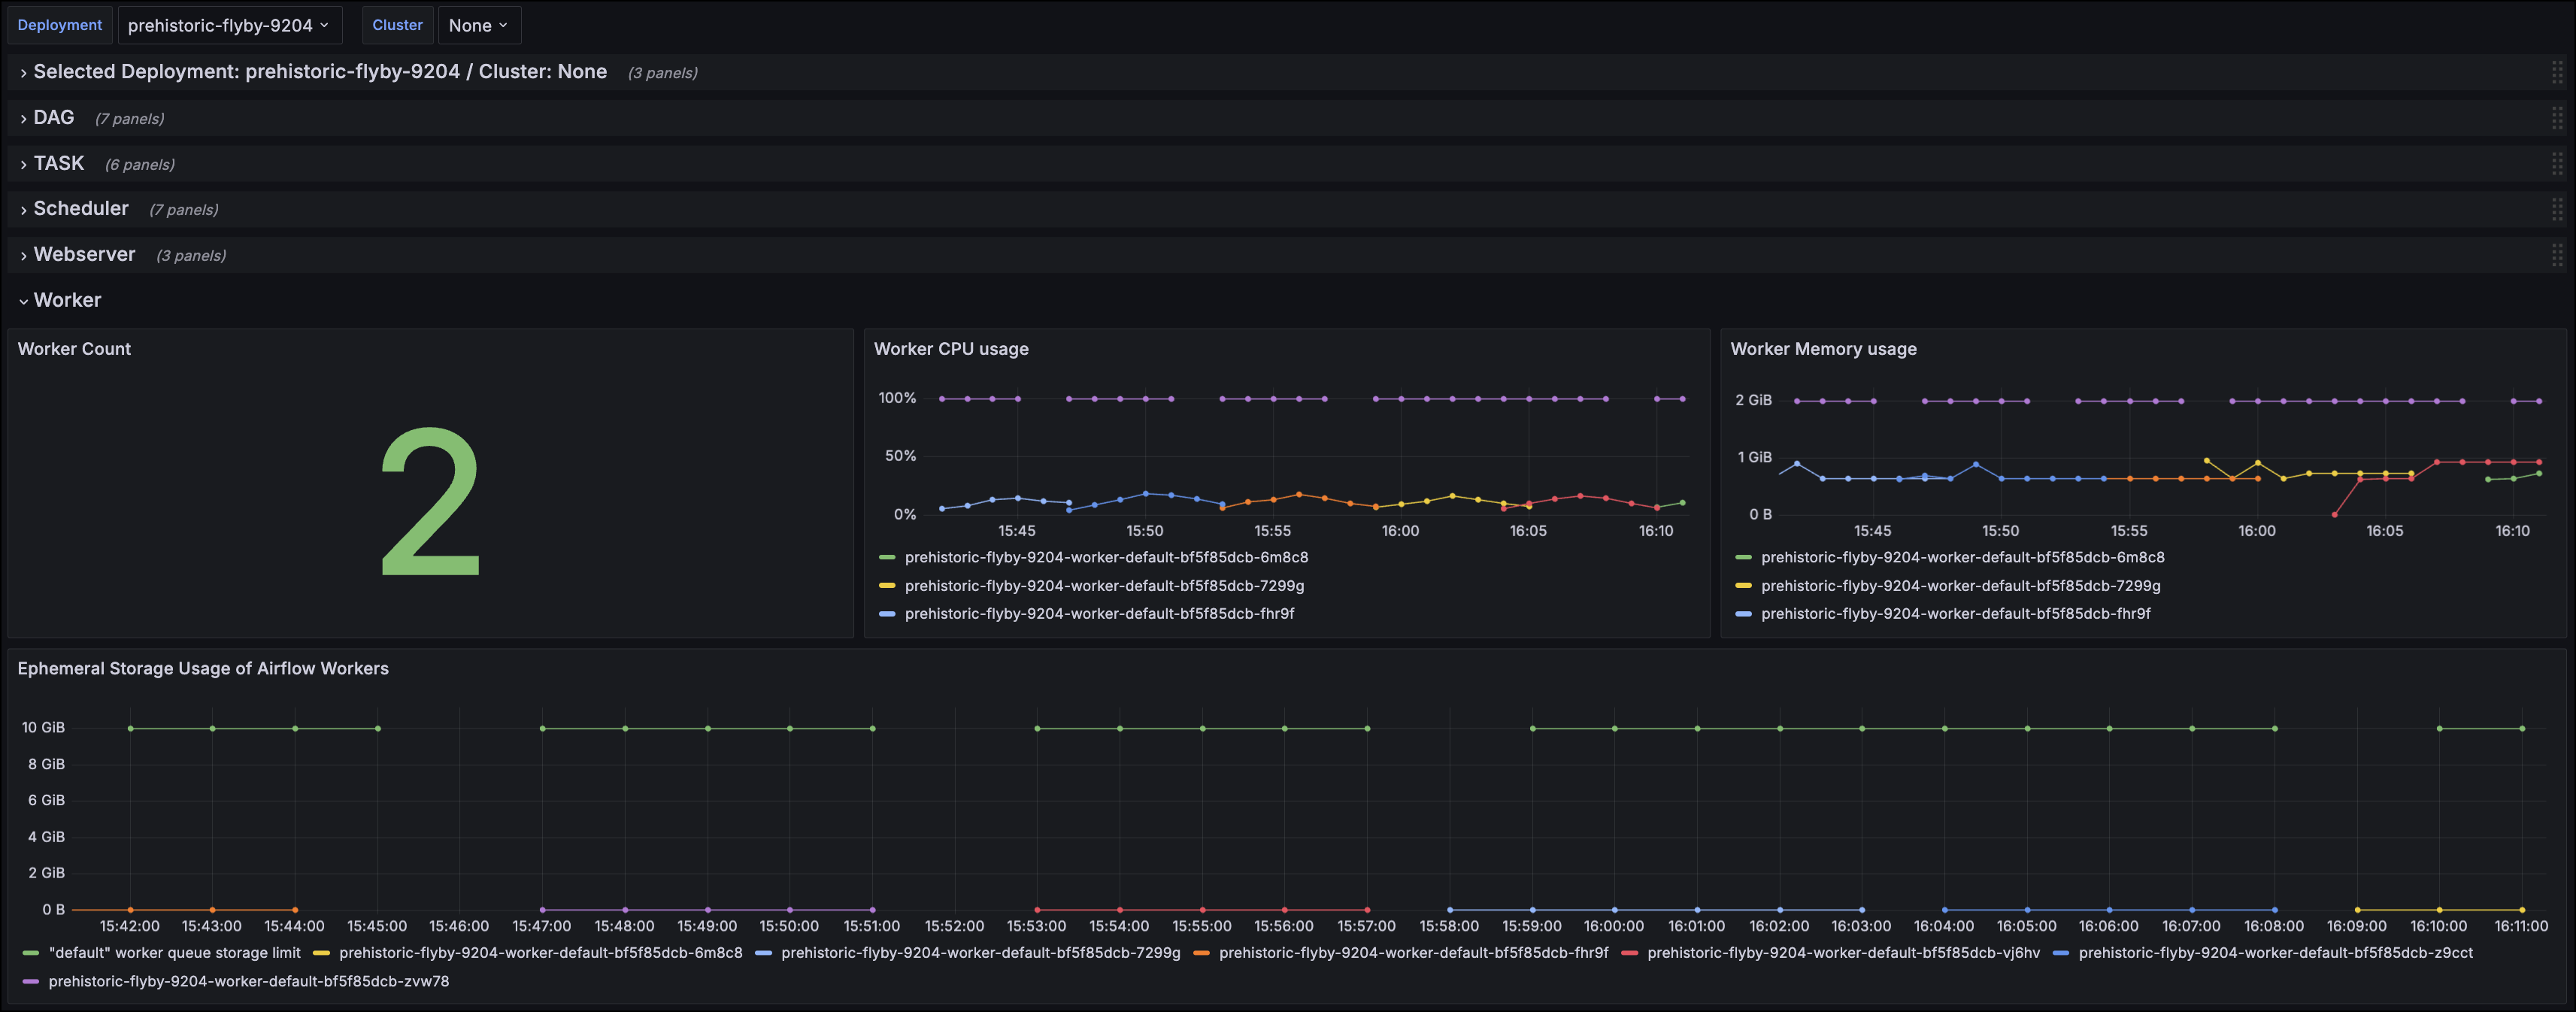
You can view an example dashboard configuration JSON file for Grafana Cloud in the Astronomer Docs GitHub repo.

This configuration file allows you to create a dashboard that provides an at-a-glance view of your Astro resources and task execution status. The following image shows an example of the Scheduler dashboard view:

Or you can view details about resources like your Workers, such as in the following image.


